

When it comes to buying real estate in Sarasota, there are several key metrics that can provide valuable insights into the market conditions and help buyers make informed decisions. Let’s take a closer look at the correlation between these metrics and what they mean for potential buyers.
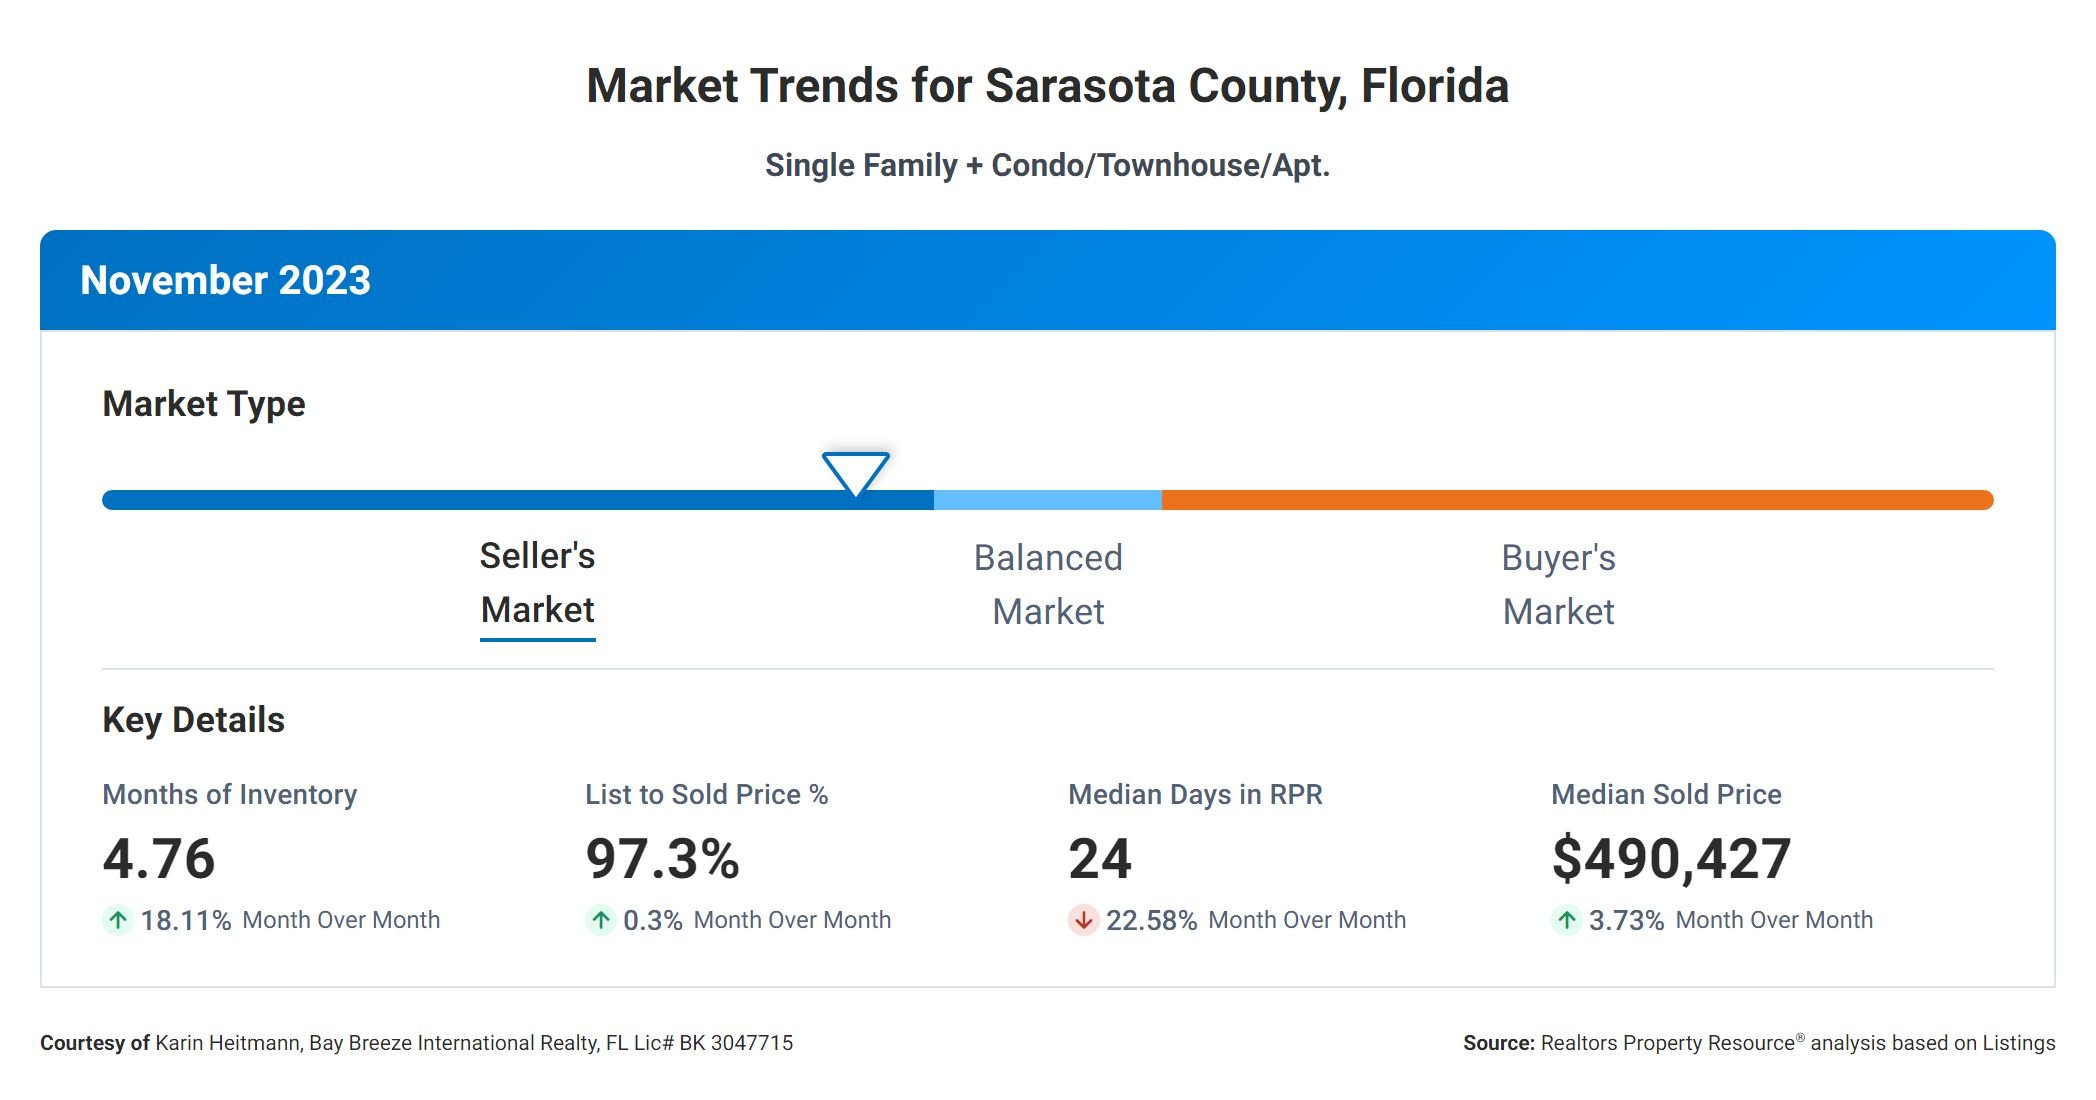
Firstly, the monthly supply of Inventory is an indicator of the balance between supply and demand in the real estate market. In this case, the months of inventory is 4.76, which means it would take approximately 4.76 months to sell all the available homes if no new listings came on the market. A lower supply typically indicates a seller’s market, where fewer homes are available compared to the number of buyers. This could result in increased competition and potentially higher prices.
Inventory of Homes
However, it’s important to note the 12-month Change in Months of Inventory, which is +142.86%. This significant increase suggests a shift in market dynamics over the past year. The supply of homes has grown substantially, potentially indicating a more balanced market tending to a buyer’s market if more listings come to the market. This change could provide buyers with more options and potentially more negotiating power.
Days on the Market
Another metric to consider is the Median Days Homes are On the Market, which is 24. This figure represents the average number of days it takes for a home to sell once it’s listed. A lower number indicates a faster-moving market where homes are in high demand. In this case, a median of 24 days suggests a relatively quick sales cycle, meaning buyers may need to act promptly when they find a property they are interested in.
List to Sold Price Ratio
The List to Sold Price ratio is another important metric to consider. It measures the percentage of the original listing price that homes are ultimately sold for. In this case, the percentage is 97.3%, indicating that homes generally sell for close to their initial asking price. This suggests a relatively stable market where sellers can command much of their listing price. However, it’s worth noting that there may still be room for negotiation, and buyers should be prepared to make competitive offers.
Median Sold Price
Finally, the Median Sold Price is $490,427. This figure represents the middle point of all the sold prices in the market. It provides an idea of the overall price range for homes in the area. Buyers can use this information to assess whether their budget aligns with the prevailing market prices and to evaluate the value they are getting for their investment.
In summary, the metrics provided offer valuable insights for buyers. The Months Supply of Inventory and the 12-month Change in Months of Inventory suggest a potential shift towards a more buyer-friendly market. The Median on the Market indicates a relatively fast-paced market, requiring buyers to act swiftly. The List to Sold Price Percentage highlights a market where sellers generally achieve close to their asking prices. Lastly, the Median Sold Price provides an idea of the prevailing price range. Armed with this information, buyers can make more informed decisions and navigate the real estate market with confidence.
Thinking of Buying or Selling a Home? We are just a phone call away!